new project: djedi
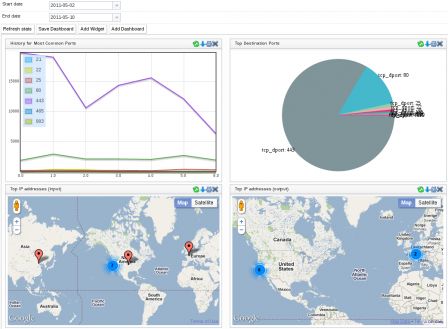
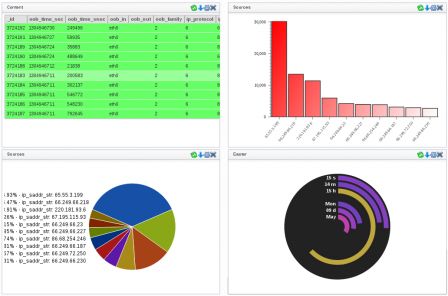
I have started a new project (yet another), pretty different from my usual programming languages: a framework for visualizing data in a browser. This framework is a Extract-Transform-Visualize tool, where data come from a database and are rendered by the browser.
Features
While some other project exist, I wanted to create a project with the following features:
- simplicity: it provide objects (widgets) that you just place in your page as you want. It also provides dashboards to manage widgets, and in its simplest form you just give the name of a div element where a graph will be rendered.
- modularity: every part of the project can be replaced easily by another component, either on the server-side (you only need an ajax server, not especially django) or the client-side (you can use javascript, svg, flash etc.)
- interactive: interactions are important, to make the interface pretty, and also to navigate in data, or to enhance visualization. Most recent web toolkits allow a good number of interactions and animations (and most of them, without using flash)
- working with big data sets: existing toolkits generally fail when dealing with big databases. Here, all requests are asynchronous and are designed to work on big tables
- open source: Djedi is licensed under the Gnu General Public license version 3 (GPLv3) and is based on open-source libraries
Note that:
- it does not required flash (only javascript, svg and css code for the moment), though writing flash plugins would be easy
- it is not tied to django or python for the server
- it is not tied to a Database (you can use any data source, be it a text file or a NoSQL DB)
- it is currently tied to Dojo for the client-side, but only for the dashboard (not for the graphs). Using another dashboard implementation is possible (and maybe will be tested for jQuery).
- it is not a security-only project, but more a generic-data-viz project
Targeted people include developers (to provide a quick way to add charts/data visualization to a page, add new custom widgets or render engines, etc.) and users (display and explore data, build custom dashboards).
See the details of the project on the Djedi Wiki page

Project Status
Current work status is the following:
- core functions are working (queries, transforms, display, etc.)
- a working application is provided for ulogd2
- writing documentation is in progress
- current implementation for application ulogd2 use python and django for the server-side, and dojo for the client-side
- working render engines include dojo, raphael, protovis, infovis, flotr and google maps
However:
- it is still a framework (not a ready to deploy application)
- you need to know django
Next objectives are to document how to write a new application, write a sample application for Snorby (which can be used to display Snort, Suricata and Sagan events).

You can help !
Help would be appreciated, in many possible ways:
- testing djedi
- reporting bugs
- looking at the documentation, and contributing if possible
- adding feature requests
- and, of course, contributing in the code, especially if you know javascript (I would love to see someone else writing the JS code, given how I like this language ..)
Project is managed using the Djedi Redmine page
If you want to test, contribute or are just curious join the #djedi channel on FreeNode
